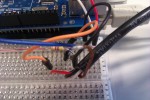
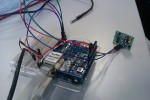
For our project we wanted to create an Ethernet data logger that could take data from a temperature sensor and a PIR motion sensor. This would allow us to graph motion and temperature over time allowing users to know when a space was most in use and perhaps whether it was being heated effectively.
Components:
- Arduino Uno
- Arduino Ethernet Shield
- Dallas Temperature Sensor (Waterproof so could be used externally)
- Tiny PIR Motion Sensor
Basic Description:
Arduino– The Arduino here connects collects the temperature data and movement data to the Internet as a client and posts data to the Google App Engine site every 60 seconds. An external interrupt allows for motion to be detected and polled at any time. The temperature is read just before the HTTP post is made.
Google App Engine — On this side the app engine takes the data posted from the Arduino and stores it in a simple / and probably inefficient database. If someone visits the site it uses the google graph api to make a pretty neat graph of the data over time.
Images:
Schematic:
Files:
Arduino Code
#include <SPI.h>
#include <Ethernet.h>
#include <OneWire.h>
#include <DallasTemperature.h>
//Cannot use Pins 4,10,11,12,13 as they are in use by ethernet shield
#define ONE_WIRE_BUS 3

// Setup a oneWire instance to communicate with any OneWire devices (not just Maxim/Dallas temperature ICs)
OneWire oneWire(ONE_WIRE_BUS);

// Pass our oneWire reference to Dallas Temperature.
DallasTemperature sensors(&oneWire);

// arrays to hold device address
DeviceAddress insideThermometer;

void postData();
void pir2ISR();
void getTemp();

//Data
float temp = 0.0;
volatile int movement = 0;
volatile int moves =0;

// Enter a MAC address for your controller below
byte mac[] = {  0x00, 0xAA, 0xBB, 0xCC, 0xDE, 0x02 };
//Server to connect to
char serverName[] = "http://091-labs.appspot.com";
// Initialize the Ethernet client library
EthernetClient client;

void setup()
{
  //Serial.begin(9600);
  // start the Ethernet connection:
  if (Ethernet.begin(mac) == 0)
  {
    while(true);
  }
  // give the Ethernet shield a second to initialize:
  delay(1000);

  sensors.begin();
  sensors.getAddress(insideThermometer, 0);
  sensors.setResolution(insideThermometer, 9);

  attachInterrupt(0,pir2ISR,RISING); //sets pin 2 as interrupt for movement pin
pinMode(2,INPUT);
}

void loop()
{
  delay(60000);
  getTemp();
  if (digitalRead(2)){
    movement=1;
    moves+=1;
  }
  postData();
  moves=0;
  movement=0;
}

void pir2ISR()
{
  moves +=1;
  movement =1;
}

void postData()
{
  String temperature = String((int)(temp+0.5));
  String move = String(movement);
  String moves1 = String(moves);
  String data = String("temp="+ temperature+"&movement="+move+"&moves="+moves1);
  while(!client.connected())
  {
    client.connect(serverName, 80);
  }
  client.println("POST /arduino_post HTTP/1.1");
  client.println("Host: 091-labs.appspot.com");
  client.println("Connection: keep-alive");
  client.print("Content-Length: ");
  client.println(data.length());
  client.println("Cache-Control: max-age=0");
  client.println("Content-Type: application/x-www-form-urlencoded");
  client.println("Accept-Language: en-US,en;q=0.8");
  client.println();
  client.print(data);
  client.println();
  char c;
  while(client.available())
  {
    c = client.read();
  }
  client.stop();
}

void getTemp()
{
  sensors.requestTemperatures();
  temp = sensors.getTempC(insideThermometer);
}
Google App Engine Code (3 files)
Main.py
#Author: Fergal O' Grady
#Google App Engine/Python 2.5
#Arduino sends HTTP POST to /arduino_post
# notes: make refresh rate a user pref?
#from google.appengine.api import users
from google.appengine.ext import webapp
from google.appengine.ext.webapp.util import run_wsgi_app
import datetime
from google.appengine.ext import db
class ArduinoSensorData(db.Model):
temp = db.IntegerProperty(default=0)
list = db.StringListProperty()
lastmovement = db.DateTimeProperty(auto_now_add=True)
lastupdate = db.DateTimeProperty(auto_now_add=True)
class ArduinoPost(webapp.RequestHandler):
def post(self):
sensordata = ArduinoSensorData.get_or_insert('1')
try:
temp = int(self.request.get('temp'))
movement = int(self.request.get('movement'))
moves = int(self.request.get('moves'))
sensordata.temp = temp
sensordata.lastupdate = datetime.datetime.now()
if movement == 1:
sensordata.lastmovement = datetime.datetime.now()
sensordata.list.append(datetime.datetime.now().strftime("%Y,%m,%d,%H,%M,%S"))
sensordata.list.append(str(temp))
sensordata.list.append(str(moves))
sensordata.put()
except ValueError:
pass
class MainPage(webapp.RequestHandler):
def get(self):
sense = ArduinoSensorData.get_or_insert('1')
timeSinceLastMovement = generateDHMString(datetime.datetime.now() - sense.lastmovement)
self.response.headers['Content-Type'] = 'text/html'
self.response.out.write('''
<html>
<meta http-equiv="refresh" content="63"/>
<head>
<title>091 labs sensor data...</title>
<script type='text/javascript' src='http://www.google.com/jsapi'></script>
<script type='text/javascript'>
google.load('visualization', '1', {'packages':['annotatedtimeline']});
google.setOnLoadCallback(drawChart);
function drawChart()
{
var data = new google.visualization.DataTable();
data.addColumn('datetime', 'Date/Time');
data.addColumn('number', 'Temperature');
data.addColumn('number', 'Movement');
data.addRows([
%s
]);
var chart = new google.visualization.AnnotatedTimeLine(document.getElementById('chart_div'));
chart.draw(data, {displayAnnotations: true});
}
</script>
</head>
<body>
<p>The temperature is %s°C</p>
<p>Movement detected %s</p>
<div id='chart_div' style='width: 700px; height: 240px;'></div>
</body>
</html>
''' % (listToRowData(sense.list),str(sense.temp), timeSinceLastMovement))
application = webapp.WSGIApplication([('/', MainPage),('/arduino_post', ArduinoPost)], debug=True)
########HelperFunction########
def listToRowData(list):
#'[new Date(year, month, day, hours, minutes, seconds), Temperature, Moves],\n'
str1 =''
for i in range(0,len(list)-2,3):
str1 = str1 + '\t[ new Date(' + list[i] + '), ' + list[i+1] + ', ' + list[i+2] + '],\n'
return str1
def generateDHMString(difference):
#60 seconds * 60 minutes * 24 hours
hours = difference.seconds // 3600
temp = difference.seconds - (hours * 3600)
minutes = temp // 60
seconds = temp - (minutes * 60)
andVal = False
ret = str(seconds) + (" second ago" if seconds == 1 else " seconds ago!")
if minutes != 0:
str1 = " minute " if minutes == 1 else " minutes "
andVal = True
ret = str(minutes) + str1 + "and " + ret
if hours !=0:
str1 = " hour" if hours == 1 else " hours"
if andVal:
ret = str(hours) + str1 + ", " + ret
else:
andVal=True
ret = str(hours) + str1 + " and " + ret
if difference.days !=0:
str1 = " day" if difference.days == 1 else " days"
if andVal:
ret = str(difference.days) + str1 + ", " + ret
else:
ret = str(difference.days) + str1 + " and " + ret
return ret
def main():
run_wsgi_app(application)
if __name__ == '__main__':
main()
App.yaml
application: 091-labs
version: 3
runtime: python
api_version: 1

handlers:

- url: /.*
script: main.py
Index.yaml
indexes:

# AUTOGENERATED

# This index.yaml is automatically updated whenever the dev_appserver
# detects that a new type of query is run.  If you want to manage the
# index.yaml file manually, remove the above marker line (the line
# saying "# AUTOGENERATED").  If you want to manage some indexes
# manually, move them above the marker line.  The index.yaml file is
# automatically uploaded to the admin console when you next deploy
# your application using appcfg.py.


Nice! It says April though =(
So it does! If you look at the page source you can see the date is ‘right’.
I’m not sure why but it seems the google chart api might be counting the months from 0 (i.e January = 0 …April = 3). I guess I’ll try (month -1) and see if that fixes it.
I made a few adjustments to fix the time issue. I used this format to log the current time in a format that worked in both GAE and Javascript. Seems like the GAE didnt like the comma version of the time for whatever reason.
UTC_OFFSET = 5
local_datetime = datetime.datetime.now()
now = (local_datetime – datetime.timedelta(hours=UTC_OFFSET)).strftime(“%Y/%m/%d %H:%M:%S”)
Also, I added double quotes around the object creation in the listToRowData function
str1 = str1 + ‘\t[ new Date(\”‘ + list[i] + ‘\”), ‘ + list[i+1] + ‘, ‘ + list[i+2] + ‘],\n’
Is there a tutorial on how to make the graph? I would like to make my own data logger. Pls email me sir
Hi Patrick, I used the google charts api to create the graph. There is more info and examples here: https://developers.google.com/chart/
hello ..
please could you indicate how to separate the two different graphics data?
Thank you.